Multiple Choice
Figure 10-18 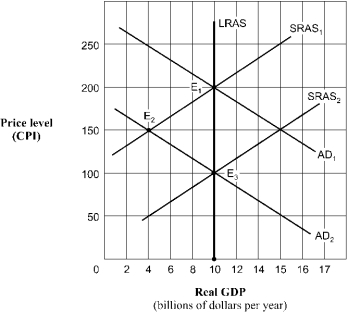
-Given the shift of the aggregate demand curve from AD1 to AD2 in Figure 10-18, the real GDP and price level (CPI) in long-run equilibrium will be
A) $10 billion and 200.
B) $4 billion and 150.
C) $10 billion and 150.
D) $10 billion and 100.
Correct Answer:

Verified
Correct Answer:
Verified
Q8: Which of the following will lead to
Q12: When the U.S. dollar appreciates,<br>A) U.S. exports
Q27: Figure 10-13 <img src="https://d2lvgg3v3hfg70.cloudfront.net/TB7347/.jpg" alt="Figure 10-13
Q28: Use the figure below to answer the
Q29: Use the figure below to answer the
Q47: Which of the following was a contributing
Q86: In the aggregate demand/aggregate supply model, an
Q92: Suppose the economy is in long-run equilibrium.
Q97: Which of the following will most likely
Q166: Other things constant, an increase in the