Essay
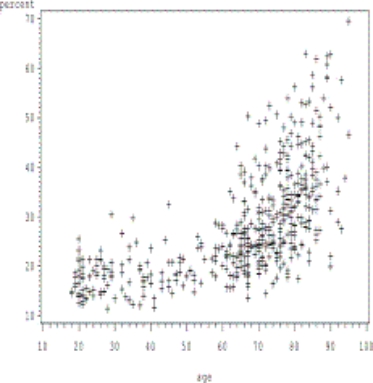
The following figure shows a scatter plot of the percent of bone loss by age. It has been suggested that there is a linear relationship between age and percent of bone loss. Is there evidence of a linear relationship in this sample? Explain
Correct Answer:

Verified
This plot does not suggest that there is...View Answer
Unlock this answer now
Get Access to more Verified Answers free of charge
Correct Answer:
Verified
View Answer
Unlock this answer now
Get Access to more Verified Answers free of charge
Q10: What can be said about R² when
Q11: An investigator conducted a study to find
Q12: In a meeting with a biostatistician to
Q13: A multiple linear regression analysis is employed
Q14: Data were collected on soy protein consumption
Q15: When a child is born, he/she may
Q16: You have performed a linear regression to
Q17: You are interested in understanding the relationship
Q18: A linear regression of age (x) on
Q20: When employing a multiple linear regression analysis,