Multiple Choice
Which graph in the figures below is a plot of a linear behavior? 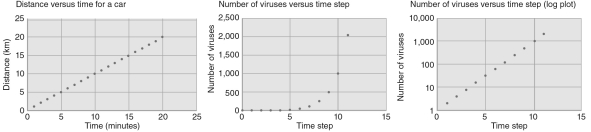
A) figure (a)
B) figure (b)
C) figure (c)
D) none of these
E) all three graphs
Correct Answer:

Verified
Correct Answer:
Verified
Related Questions
Q83: What does the word dark mean in
Q84: The speed of light is approximately<br>A) 3,000
Q85: Explain the scientific definitions for the terms
Q86: After the Sun, the next nearest star
Q87: The number 123,000 written in scientific notation
Q89: According to the figure below, Earth is
Q90: When a change occurs on the surface
Q91: If one thinks about the distance between
Q92: What is the only thing that makes
Q93: Albert Einstein's theory of relativity replacing Isaac