Essay
The two panels in the figure below display the same data.Explain why the trends look different between the two graphs. 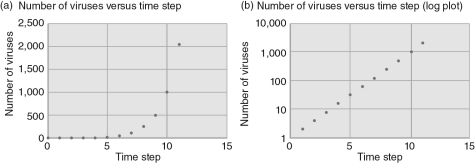
Correct Answer:

Verified
The y-axes scales are different.In panel...View Answer
Unlock this answer now
Get Access to more Verified Answers free of charge
Correct Answer:
Verified
The y-axes scales are different.In panel...
View Answer
Unlock this answer now
Get Access to more Verified Answers free of charge
Related Questions
Q33: What is the slope of line in
Q34: (6 * 10<sup>5</sup>) * (3 *10<sup>-</sup><sup>2</sup>) =<br>A)
Q35: Our universe is approximately 13.7 _ years
Q36: What is the Local Group?
Q37: The Andromeda Galaxy is also part of
Q39: Describe the two main aspects of the
Q40: If nature behaves according to a certain
Q41: The volume of a sphere is related
Q42: One of the nearest stars is Alpha
Q43: One of the nearest stars, Alpha Centauri,