Multiple Choice
The figure below illustrates a stellar spectrum.The dip in the data near 650 nm corresponds most closely with which of the following? 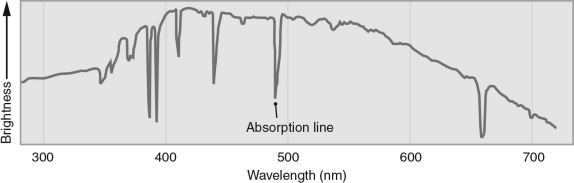
A) sodium emission
B) sodium absorption
C) hydrogen emission
D) hydrogen absorption
E) iron absorption
Correct Answer:

Verified
Correct Answer:
Verified
Related Questions
Q90: A spaceship is traveling toward Earth while
Q91: You are driving on the freeway when
Q92: What is the difference between visible light
Q93: When talking about a wave, what does
Q94: How can the average temperature of Earth
Q95: You observe a red star and a
Q96: What two factors control the surface temperature
Q97: If the Sun's luminosity were twice its
Q99: The Doppler shift can be used to
Q100: How is the energy of a photon