Multiple Choice
The figure below shows a graph of the scale factor, RU, with time, for three different scenarios.The age of the universe is the difference between now and the time at which RU is zero.Which curve illustrates a universe that is expanding at a constant rate? 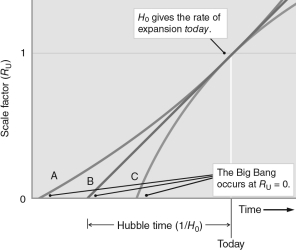
A) A
B) B
C) C
D) All of these curves are valid for constantly-expanding universe.
E) None of these curves is valid for constantly-expanding universe.
Correct Answer:

Verified
Correct Answer:
Verified
Q51: In a closed (spherical) universe, the
Q52: What was the temperature of the universe
Q53: Summarize the possible shapes of the universe
Q54: In the 1990s, astronomers studying distant Type
Q55: If the Hubble constant had a
Q57: At what temperature would the peak wavelength
Q58: Scientists think that, soon after the Big
Q59: The figure below shows five graphs
Q60: Even with infinitely powerful telescopes, we can
Q61: To verify whether some grand unified theories