Multiple Choice
The figure below shows five possible graphs of the scale factor of the universe as a function of time.Which of these graphs represent our universe, where m = 0.3 and =0.7? 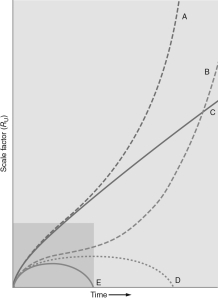
A) A
B) B
C) C
D) D
E) E
Correct Answer:

Verified
Correct Answer:
Verified
Related Questions
Q9: What particles are the carriers of the
Q10: If <span class="ql-formula" data-value="\Omega"><span class="katex"><span
Q11: Which fundamental force is responsible for radioactive
Q12: If there were no dark energy
Q13: Grand unified theories are very attractive because
Q15: The left panel of the figure below
Q16: The Big Rip could occur in a
Q17: The figure below shows a graph of
Q18: Which of the four fundamental forces is
Q19: Why does the production of electron-positron pairs