Multiple Choice
Use the figure below to answer the following questions.
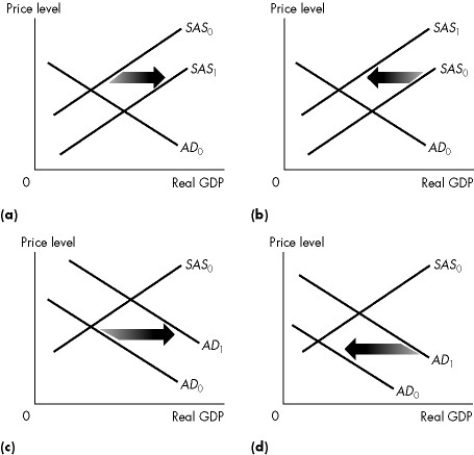
Figure 26.2.1
-Refer to Figure 26.2.1.Which graph illustrates what happens when the quantity of money decreases?
A) (a)
B) (b)
C) (c)
D) (d)
E) None of the above
Correct Answer:

Verified
Correct Answer:
Verified
Related Questions
Q19: Use the figure below to answer the
Q58: Use the figure below to answer the
Q67: Which one of the following is a
Q69: Use the figure below to answer the
Q71: Use the figure below to answer the
Q75: Which one of the following variables is
Q93: Use the table below to answer the
Q109: The economy cannot remain indefinitely with real
Q122: Which one of the following newspaper quotations
Q132: Use the figure below to answer the