Multiple Choice
The following scatter plot indicates: 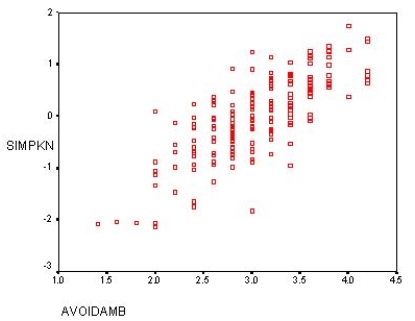
A) No relationship
B) A positive relationship
C) A negative relationship
D) A nonlinear relationship
Correct Answer:

Verified
Correct Answer:
Verified
Related Questions
Q18: Which of the following is an example
Q19: A mixed method study is one that
Q20: A variable that delineates how a relationship
Q21: The following scatter plot indicates: <img src="https://d2lvgg3v3hfg70.cloudfront.net/TB7436/.jpg"
Q22: The proposition that one cannot mix quantitative
Q24: A group of researchers conducted a study
Q25: Mixed research concerns itself with assessing subjective,
Q26: A form of qualitative research that focuses
Q27: Ethnography is a _ research method.<br>A) quantitative<br>B)
Q28: Explain the concept of a correlation coefficient.