Multiple Choice
Three scatter diagrams are given below.How many of the diagrams present data that can be described by a linear relationship and,therefore,justifiably summarized by the correlation coefficient?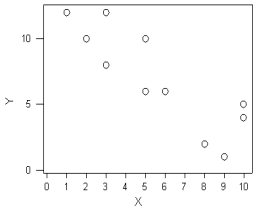
Plot A Plot B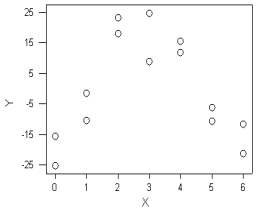
Plot C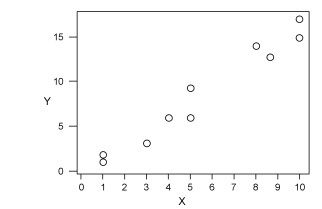
A) Plot A
B) Plot B
C) Plot A and Plot B
D) Plot A and Plot C
Correct Answer:

Verified
Correct Answer:
Verified
Q6: Collecting,organizing,summarizing,and presenting data is referred to as
Q7: Explain the major lesson to be learned
Q8: All of the following are illustrated by
Q9: Statistical thinking is a philosophy of learning
Q10: According to Deming,the study of a dynamic
Q12: _ involves drawing inferences about two contrasting
Q13: A particular type of plastic soap bottle
Q14: One of the biggest mistakes that people
Q15: Partitioning a population into hierarchical groups or
Q16: Special-cause variation tends to be easily detectable