Multiple Choice
Exhibit 10-2
A manager of a hotel chain is interested in investigating whether there is a relationship between staff labor hours and bed-day occupancy incurred by a hotel in a month.The manager randomly selected 17 of the hotels in the chain across the country and recorded, for each of the hotels, the staff's total labor hours for the month of July and the number of bed-days of occupancy for that month. (A hotel has occupied one "bed-day" if one bed is occupied (rented) for an entire day.) The manager is interested in seeing if the labor hours incurred can be predicted from the number of bed-days of occupancy on a monthly basis.
The sample data were analyzed using Excel.Shown below is part of the regression analysis output.
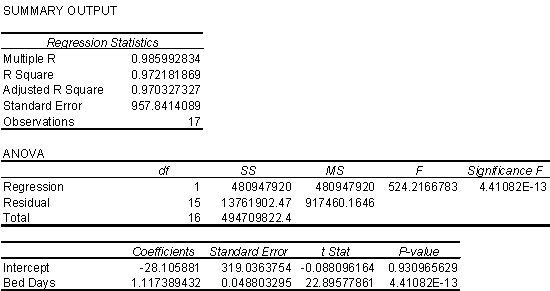
-Refer to Exhibit 10-2.According to this regression analysis,if the number of bed-days increases by 200,what is the predicted change in the number of labor hours required for a given month?
A) a decrease of 5621.2
B) a decrease of 17.6
C) an increase of 223.5
D) an increase of 882.2
Correct Answer:

Verified
Correct Answer:
Verified
Q70: Which of the following is NOT a
Q79: If two variables are negatively correlated,when one
Q80: In hypothesis testing,the null hypothesis,H?,is assumed to
Q81: Exhibit 10-1<br>In an audit of the outstanding
Q83: In simple regression,a function describes how the
Q84: Characteristics of the population are called:<br>A)point estimates.<br>B)random
Q85: A confidence interval is a point estimate
Q85: Which of the following constitutes an approach
Q86: Explain the three fundamental principles of statistical
Q87: In Deming's view,variation is the root cause