Multiple Choice
Exhibit 10-3
An engineer collected data from three different types of power drills.Specifically, the engineer collected data on how long (in minutes) each type of drill would run continuously after a full battery recharge.Each drill was charged and run continuously 15 times.The reported data are contained in the following table.The engineer analyzed the data using one-way ANOVA in Excel and the results from Excel are also given below.

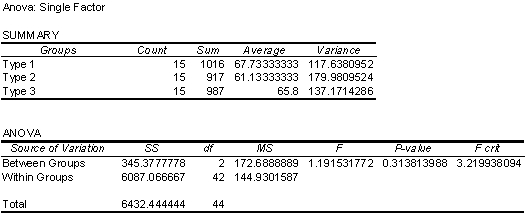
-Refer to Exhibit 10-3.The one-way ANOVA was used to determine if the population mean continuous run times are equal (the null hypothesis) for all three types of drills,or if all pairs of population means are not equal (the alternative hypothesis) .Which decisions could the manager make?
A) Reject the null hypothesis using a 5% significance level, and reject the null hypothesis using a 1% significance level.
B) Reject the null hypothesis using a 5% significance level, but do not reject the null hypothesis using a 1% significance level.
C) Reject the null hypothesis using a 1% significance level, but do not reject the null hypothesis using a 5% significance level.
D) Do not reject the null hypothesis using a 5% significance level, and do not reject the null hypothesis using a 1% significance level.
Correct Answer:

Verified
Correct Answer:
Verified
Q53: Everything else remaining constant,when the sample size
Q56: A sample of size sixteen is randomly
Q58: Understanding processes provides the context for determining
Q59: A mathematical function that assigns numerical values
Q61: A purpose of the Funnel Experiment is
Q62: The collectively exhaustive set of outcomes from
Q63: Suppose that a scatter diagram depicts a
Q65: Define the following terms:<br>a.Parameter<br>b.Point estimate<br>c.Random variable<br>d.Standard error
Q81: Products are boxed in groups of 25.Drawing
Q85: A government report gives a 99% confidence