Multiple Choice
Exhibit 10-3
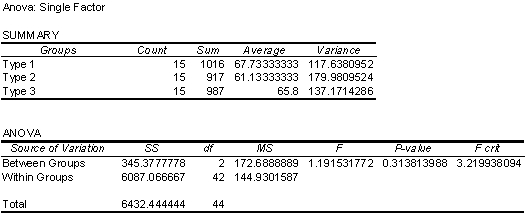
An engineer collected data from three different types of power drills.Specifically, the engineer collected data on how long (in minutes) each type of drill would run continuously after a full battery recharge.Each drill was charged and run continuously 15 times.The reported data are contained in the following table.The engineer analyzed the data using one-way ANOVA in Excel and the results from Excel are also given below.


-Refer to Exhibit 10-3.What is the 95% confidence interval for the population mean continuous run time for the Type 3 drill?
A) (59.5, 72.1)
B) (54.1, 77.5)
C) (58.0, 73.6)
D) (59.9, 71.7)
Correct Answer:

Verified
Correct Answer:
Verified
Q25: When interactions are present in an experiment,main
Q35: A _ represents a theoretical model of
Q36: A stable system contains only common cause
Q37: The Red Bead Experiment demonstrates that common-cause
Q38: Correlation is a measure of the linear
Q39: Which of the following is NOT an
Q41: A manager at a market research firm
Q42: Historical production data indicate that the diameter
Q43: _ sampling is based on the assumption
Q45: What are the advantages of studying a