Multiple Choice
Three scatter diagrams are given below.How many of the diagrams present data that can be described by a linear relationship and,therefore,justifiably summarized by the correlation coefficient?
Plot A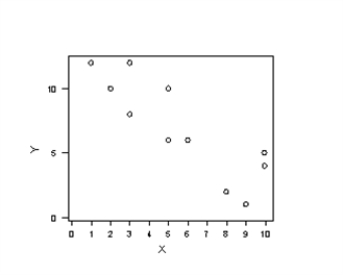
Plot B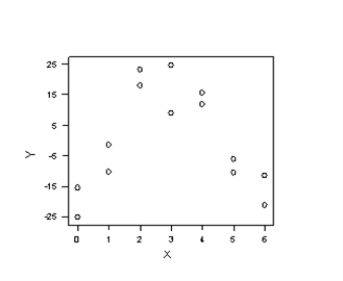
Plot C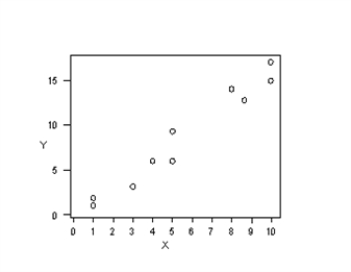
A) Plot A
B) Plot B
C) Plot A and Plot B
D) Plot A and Plot C
Correct Answer:

Verified
Correct Answer:
Verified
Q18: A manager was assigned the task of
Q19: What are the typical soldering defects in
Q20: In hypothesis testing,the null hypothesis,H0,is assumed to
Q21: Define binomial and Poisson distributions.State their probability
Q22: A sample of size 16 is randomly
Q24: Statistical methods help managers make sense of
Q25: When interactions are present in an experiment,main
Q26: The component of statistical methodology that includes
Q27: The conditional probability of an event A
Q28: Two events are independent if they have