Essay
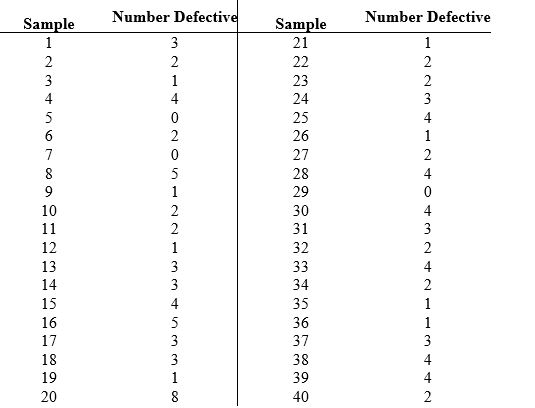
A quality engineer took 40 samples of 100 transistors each from the output of an assembly line.Each transistor was tested and the number of defectives in each sample is recorded in the table below.Determine the control chart limits for a p-chart.
Correct Answer:

Verified
Correct Answer:
Verified
Related Questions
Q68: A precision parts manufacturer produces bolts
Q69: Construct a flow chart that illustrates the
Q70: A company wishes to monitor the
Q71: The larger the sample size,the narrower the
Q72: The center line for the np-chart is
Q74: A better alternative to the
Q75: Which of the following is a major
Q76: Which of the following is NOT an
Q77: Attribute measurement requires a much larger sample
Q78: A specification is 50.0 cm ± 10.0