Multiple Choice
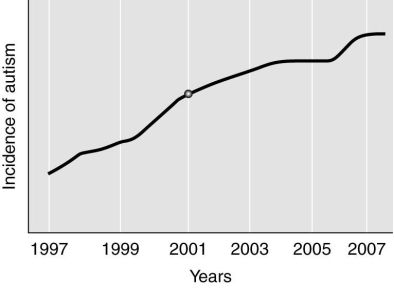 The graph above depicts the relative increase in autism in children from 1997 to 2007 living in California. In 2001, the additive thimerosal was removed from most childhood vaccines. Based on the information presented in the graph, what can be concluded about the hypothesis that thimerosal causes autism?
A) Thimerosal, at the very least, contributes to the occurrence of autism as evidenced by the almost logarithmic increase in children with autism from 2001 to 2007.
B) Prior to 2001, thimerosal clearly influenced the cases of autism in California.
C) A sharp decrease in the cases of autism would be expected after 2001 if thimerosal was the causative agent of autism.
D) The results of the study are inclusive.
E) Thimerosal requires some other agent to help induce autism.
Correct Answer:

Verified
Correct Answer:
Verified
Q39: A(n) _ is a category of the
Q40: Each of the following terms is related
Q41: Match each criterion that defines living organisms
Q42: The validity of a prediction in the
Q43: Match each domain or kingdom to its
Q45: A carefully planned and executed manipulation of
Q46: In science, graphs are often used to
Q47: Organisms made up of one cell are
Q48: Match each domain or kingdom to its
Q49: <img src="https://d2lvgg3v3hfg70.cloudfront.net/TB7437/.jpg" alt=" Based on the