Multiple Choice
The graph in the figure shows the variation of the electric potential V (measured in volts) as a function of the radial direction r (measured in meters) . For which range or value of r is the magnitude of the electric field the largest? 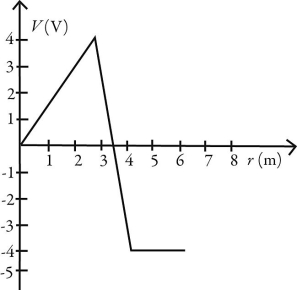
A) from r = 0 m to r = 3 m
B) from r = 3 m to r = 4 m
C) from r = 4 m to r = 6 m
D) at r = 3 m
E) at r = 4 m
Correct Answer:

Verified
Correct Answer:
Verified
Q6: The capacitive network shown in the figure
Q8: Three capacitors, with capacitances <img src="https://d2lvgg3v3hfg70.cloudfront.net/TB7476/.jpg" alt="Three
Q12: A metallic sphere of radius 5 cm
Q13: Three capacitors are arranged as shown in
Q14: A 1.0 μF capacitor has a potential
Q16: The potential as a function of position
Q18: A parallel-plate capacitor has plates of area
Q27: Three capacitors,of capacitance 5.00 μF,10.0 μF,and 50.0
Q30: An ideal air-filled parallel-plate capacitor has round
Q42: A 6.0-μF air-filled capacitor is connected across