Multiple Choice
In the figure, which of the curves best represents the variation of wave speed as a function of tension for transverse waves on a stretched string? 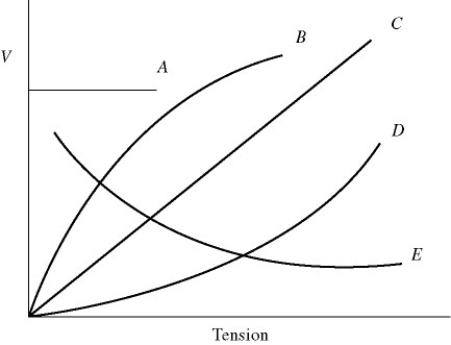
A) A
B) B
C) C
D) D
E) E
Correct Answer:

Verified
Correct Answer:
Verified
Related Questions
Q1: A heavy stone of mass m is
Q3: The figure shows the displacement y of
Q7: For the wave shown in the figure,
Q8: Waves travel along a 100-m length of
Q13: If the intensity level at distance d
Q24: The intensity level of a "Super-Silent" power
Q26: Calculate the light intensity 1.51 m from
Q34: What characteristic of sound determines the "pitch"
Q37: The vertical displacement y(x,t)of a string stretched
Q42: Two people are talking at a distance