Multiple Choice
Which of the graphs in the figure represents a spring that gets less stiff the more it is stretched? 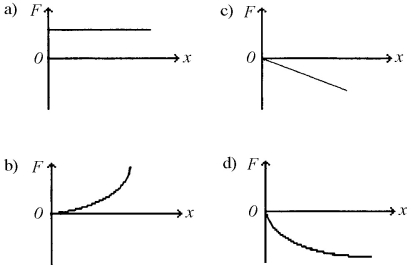
A) Graph a
B) Graph b
C) Graph c
D) Graph d
Correct Answer:

Verified
Correct Answer:
Verified
Related Questions
Q37: A constant horizontal pull acts on a
Q38: An object attached to an ideal massless
Q39: A spring stretches by <img src="https://d2lvgg3v3hfg70.cloudfront.net/TB7476/.jpg" alt="A
Q40: The value of the dot product of
Q41: Two objects, one of mass m and
Q43: In the figure, a 700-kg crate is
Q44: Block A (0.40 kg) and block B
Q45: If the dot product of two nonzero
Q46: What is the angle between the vector
Q47: A 1000.0 kg car is moving at