Multiple Choice
A graph of the force on an object as a function of its position is shown in the figure. Determine the amount of work done by this force on the object during a displacement from x = -2.00 m to x = 2.00 m. (Assume an accuracy of 3 significant figures for the numbers
On the graph.) 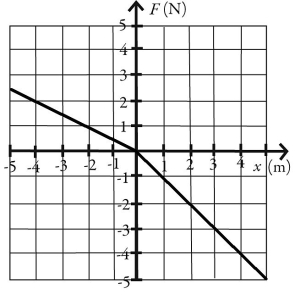
A) -12.0 J
B) -3.00 J
C) -1.00 J
D) 12.0 J
E) 3.00 J
Correct Answer:

Verified
Correct Answer:
Verified
Q20: An unusual spring has a restoring force
Q24: An airplane flies 120 km at a
Q40: The coefficient of the restitution of an
Q48: The scalar product of vector <img src="https://d2lvgg3v3hfg70.cloudfront.net/TB7476/.jpg"
Q50: For the vectors shown in the figure,
Q52: Calculate the minimum average power output necessary
Q54: A traveler pulls on a suitcase strap
Q55: A car needs to generate <img src="https://d2lvgg3v3hfg70.cloudfront.net/TB7476/.jpg"
Q56: In the figure, a 900-kg crate is
Q58: In the figure, two identical ideal massless