Multiple Choice
Figure 30-1 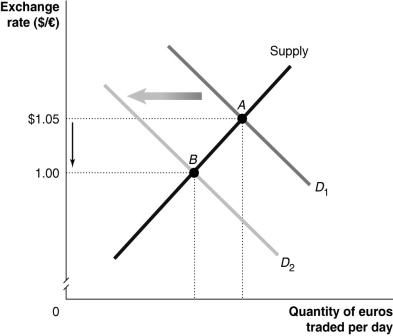
-Refer to Figure 30-1. Which of the following would cause the change depicted in the figure above?
A) U.S. productivity rises relative to European productivity.
B) Europeans decrease their preferences for U.S. goods relative to European goods.
C) The European Union increases its quotas on U.S.-produced wine.
D) an increase in the price level of U.S. goods relative to European goods
Correct Answer:

Verified
Correct Answer:
Verified
Q10: Figure 30-3 <img src="https://d2lvgg3v3hfg70.cloudfront.net/TB7397/.jpg" alt="Figure 30-3
Q14: Figure 30-7 <img src="https://d2lvgg3v3hfg70.cloudfront.net/TB7397/.jpg" alt="Figure 30-7
Q31: Although the pegged exchange rate between the
Q55: All of the following actions were taken
Q93: Which of the following is not an
Q125: If the equilibrium exchange rate exceeds the
Q131: How were countries whose industries competed with
Q140: In 1931,the first major country to abandon
Q182: What do reports that the dollar is
Q192: If a country sets a pegged exchange