Multiple Choice
Figure 30-1 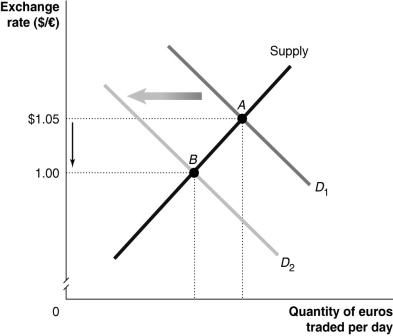
-Refer to Figure 30-1. Which of the following would cause the change depicted in the figure above?
A) U.S. productivity falls relative to European productivity.
B) Americans increase their preferences for goods produced in the EU relative to American goods.
C) The United States imposes a quota on wine from the European Union.
D) The price level of goods produced in the EU decreases relative to the price level of goods produced in the United States.
Correct Answer:

Verified
Correct Answer:
Verified
Q8: When foreign investors in Thailand began to
Q22: If the average productivity of Indian firms
Q25: Foreign currency prices of the U.S.dollar are
Q91: China began pegging its currency,the yuan,to the
Q109: Figure 30-10 <img src="https://d2lvgg3v3hfg70.cloudfront.net/TB7397/.jpg" alt="Figure 30-10
Q121: If speculators believe a currency is soon
Q136: An increase in the value of the
Q181: The currency adopted by most countries in
Q236: If inflation in Russia is higher than
Q243: If the implied exchange rate between Big