Multiple Choice
Figure 26-4 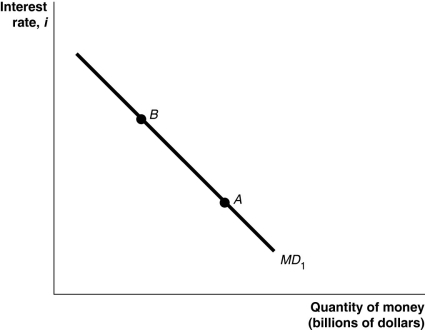
-Refer to Figure 26-4. In the figure above, a movement from point A to point B would be caused by
A) a decrease in real GDP.
B) an increase in the price level.
C) a decrease in the price level.
D) an increase in the interest rate.
Correct Answer:

Verified
Correct Answer:
Verified
Q3: The dynamic aggregate demand and aggregate supply
Q17: When the Federal Reserve increases the money
Q38: Does the money demand curve have a
Q77: The Taylor rule accurately predicted the changes
Q93: What actions should the Fed take if
Q154: With the federal funds rate near zero
Q169: Figure 26-7 <img src="https://d2lvgg3v3hfg70.cloudfront.net/TB7397/.jpg" alt="Figure 26-7
Q193: The leader of the monetarist school and
Q206: The federal funds rate is<br>A)the interest rate
Q219: Most economists believe that the best monetary