Multiple Choice
Figure 24-3 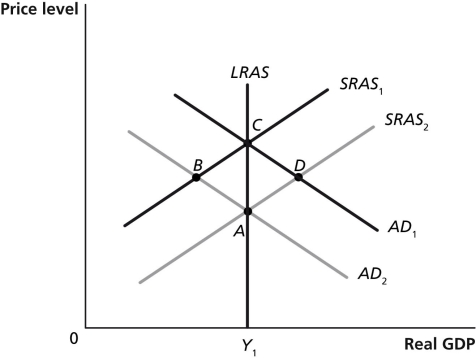
-Refer to Figure 24-3. Which of the points in the above graph are possible short-run equilibria but not long-run equilibria? Assume that Y1 represents potential GDP.
A) A and B
B) A and C
C) C and D
D) B and D
Correct Answer:

Verified
Correct Answer:
Verified
Q4: Which aggregate supply curve has a positive
Q12: Last week,13 Mexican pesos could purchase one
Q24: An increase in government spending will result
Q64: An increase in the value of which
Q154: When the economy enters a recession,your employer
Q178: According to the "wealth effect," when the
Q206: What are sticky prices,and how can contracts
Q215: Starting from long-run equilibrium,use the basic aggregate
Q229: The aggregate demand curve shows the relationship
Q230: Figure 24-2 <img src="https://d2lvgg3v3hfg70.cloudfront.net/TB7397/.jpg" alt="Figure 24-2