Multiple Choice
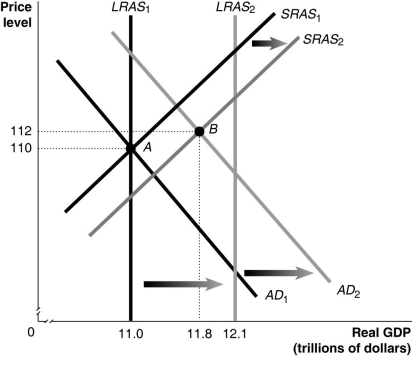
Figure 24-4 
-Refer to Figure 24-4. In the figure above, LRAS1 and SRAS1 denote LRAS and SRAS in year 1, while LRAS2 and SRAS2 denote LRAS and SRAS in year 2. Given the economy is at point A in year 1, what is the growth rate in potential GDP in year 2?
A) 8%
B) 9.1%
C) 10%
D) 12%
Correct Answer:

Verified
Correct Answer:
Verified
Q38: In the dynamic aggregate demand and aggregate
Q67: The _ curve has a positive slope
Q81: Why are the long-run effects of an
Q120: Figure 24-1 <img src="https://d2lvgg3v3hfg70.cloudfront.net/TB7397/.jpg" alt="Figure 24-1
Q124: Figure 24-3 <img src="https://d2lvgg3v3hfg70.cloudfront.net/TB7397/.jpg" alt="Figure 24-3
Q186: Short-run macroeconomic equilibrium occurs when<br>A)aggregate demand and
Q223: Potential GDP refers to the level of<br>A)real
Q242: An increase in the price level results
Q247: According to the real business cycle model,_
Q261: The business cycle _ on KB Homes