Multiple Choice
Figure 24-4 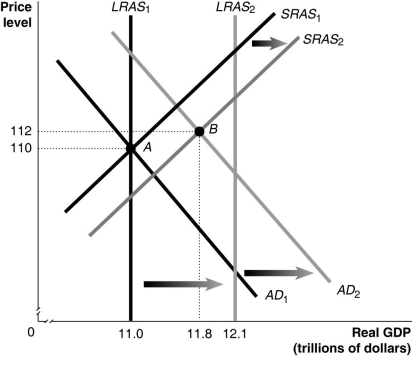
-Refer to Figure 24-4. In the figure above, AD1, LRAS1 and SRAS1 denote AD, LRAS and SRAS in year 1, while AD2, LRAS2 and SRAS2 denote AD, LRAS and SRAS in year 2. Given the economy is at point A in year 1, what is the actual growth rate in GDP in year 2?
A) 2.5%
B) 7.3%
C) 8.0%
D) 10.0%
Correct Answer:

Verified
Correct Answer:
Verified
Q28: The _ shows the relationship between the
Q35: The long-run aggregate supply curve<br>A)has a negative
Q46: Suppose a developing country experiences a reduction
Q59: Which of the following is considered a
Q83: Using an aggregate demand graph,illustrate the impact
Q119: Using an aggregate demand graph,illustrate the impact
Q179: A negative supply shock in the short
Q184: The level of aggregate supply in the
Q266: The international trade effect states that a(n)_
Q273: Ceteris paribus,in the long run,a negative supply