Multiple Choice
Figure 21-1 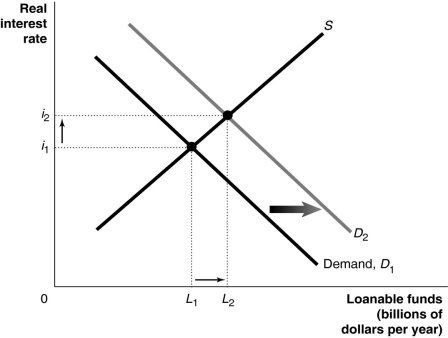
-Refer to Figure 21-1. Which of the following is consistent with the graph depicted above?
A) An expected recession decreases the profitability of new investment.
B) Technological change increases the profitability of new investment.
C) The government runs a budget surplus.
D) Households become spendthrifts and begin to save less.
Correct Answer:

Verified
Correct Answer:
Verified
Q23: Long-run economic growth requires all of the
Q55: Retained earnings are always sufficient to finance
Q161: Which of the following will result in
Q163: Which of the following explains why fluctuations
Q178: The response of investment spending to an
Q181: The NBER's Business Cycle Dating Committee defines
Q188: Which of the following would encourage economic
Q204: Financial securities that represent promises to repay
Q230: During a recession,spending on _ tends to
Q248: An increase in the government budget deficit