Multiple Choice
Figure 21-4 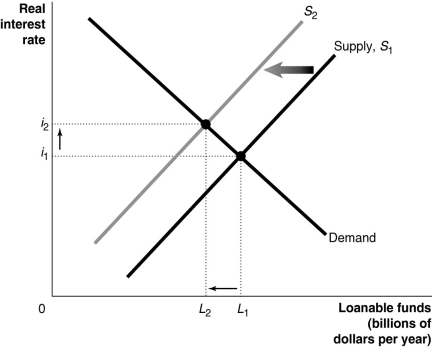
-Refer to Figure 21-4. Which of the following is consistent with the graph depicted?
A) an increase in household income
B) an increase in transfer payments to households
C) an increase in the proportion of income after net taxes used for consumption
D) an increase in tax revenues collected by the government
Correct Answer:

Verified
Correct Answer:
Verified
Q14: A period of expansion in the business
Q82: Since 1900,real GDP per capita has _
Q111: Economist Steve Landsburg has pointed out that
Q122: How have government policies and programs affected
Q123: Consider the following data for a closed
Q162: Cutting costs at the beginning of a
Q166: Since 1900,real GDP in the United States
Q208: A(n)_ comes to an end with a
Q228: The Business Cycle Dating Committee defines a
Q243: Inflation is measured<br>A)using the level of the