Multiple Choice
Figure 20-1 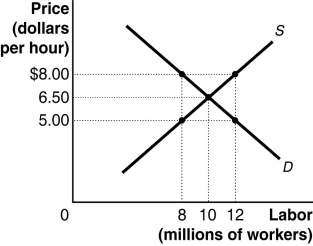
-Refer to Figure 20-1. Based on the graph of the labor market above, if a minimum wage of $8 per hour is imposed, which of the following will result?
A) The quantity of labor demanded by firms will rise.
B) The quantity of labor demanded by firms will fall.
C) The unemployment rate will fall.
D) Both A and C will occur.
Correct Answer:

Verified
Correct Answer:
Verified
Q1: Mike has been unemployed for over a
Q3: Explain what economists mean by full employment
Q9: Suppose you lend $1,000 at an interest
Q20: Why would a firm pay efficiency wages?
Q72: The PPI is the<br>A)price parity index.<br>B)prime producer
Q92: Which of the following is true about
Q166: Table 20-5<br> <img src="https://d2lvgg3v3hfg70.cloudfront.net/TB7397/.jpg" alt="Table 20-5
Q234: If you want to earn a real
Q247: You borrow $10,000 from a bank for
Q253: The producer price index tracks the prices