Multiple Choice
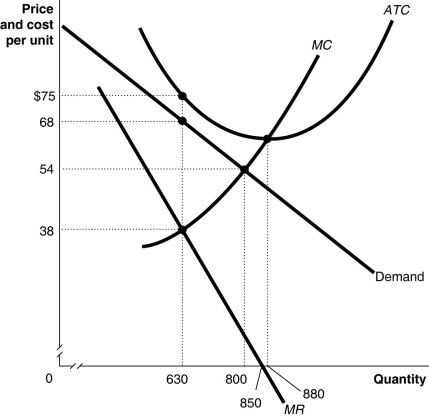
Figure 15-3

Figure 15-3 above shows the demand and cost curves facing a monopolist.
-Refer to Figure 15-3.Suppose the monopolist represented in the diagram above produces positive output.What is the profit/loss per unit?
A) loss of $7 per unit
B) profit of $30 per unit
C) loss of $21 per unit
D) profit of $14 per unit
Correct Answer:

Verified
Correct Answer:
Verified
Q43: One reason patent protection is vitally important
Q44: Figure 15-4<br> <img src="https://d2lvgg3v3hfg70.cloudfront.net/TB4193/.jpg" alt="Figure 15-4
Q45: A firm that is the only seller
Q46: Figure 15-19<br> <img src="https://d2lvgg3v3hfg70.cloudfront.net/TB4193/.jpg" alt="Figure 15-19
Q47: Figure 15-9<br> <img src="https://d2lvgg3v3hfg70.cloudfront.net/TB4193/.jpg" alt="Figure 15-9
Q49: Market power in the United States causes
Q50: Suppose a monopoly is producing its profit-maximizing
Q51: Merger guidelines developed by the Antitrust Division
Q52: What type of protection does U.S.law grant
Q53: Figure 15-15<br> <img src="https://d2lvgg3v3hfg70.cloudfront.net/TB4193/.jpg" alt="Figure 15-15