Multiple Choice
Figure 15-4
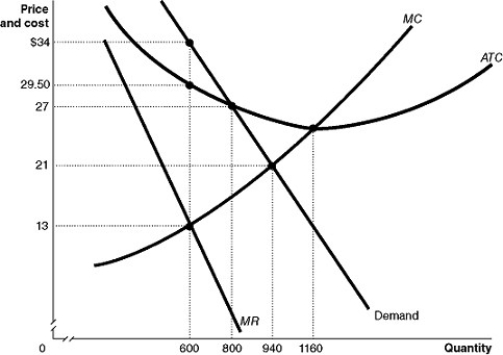
Figure 15-4 shows the demand and cost curves for a monopolist.
-Refer to Figure 15-4.What is the amount of the monopoly's total revenue?
A) $21,600
B) $20,400
C) $19,740
D) $7,800
Correct Answer:

Verified
Correct Answer:
Verified
Q224: Although some economists believe network externalities are
Q225: The Clayton Act is an antitrust law
Q226: Figure 15-4<br> <img src="https://d2lvgg3v3hfg70.cloudfront.net/TB4193/.jpg" alt="Figure 15-4
Q227: Article Summary<br>In late 2017, informed sources announced
Q228: If a monopolist's price is $50 at
Q230: Economic efficiency requires that a natural monopoly's
Q231: BHP Billiton is a Canadian company that
Q232: Figure 15-3<br> <img src="https://d2lvgg3v3hfg70.cloudfront.net/TB4193/.jpg" alt="Figure 15-3
Q233: Table 15-2<br> <img src="https://d2lvgg3v3hfg70.cloudfront.net/TB4193/.jpg" alt="Table 15-2
Q234: "Being the only seller in the market,