Multiple Choice
Figure 15-10 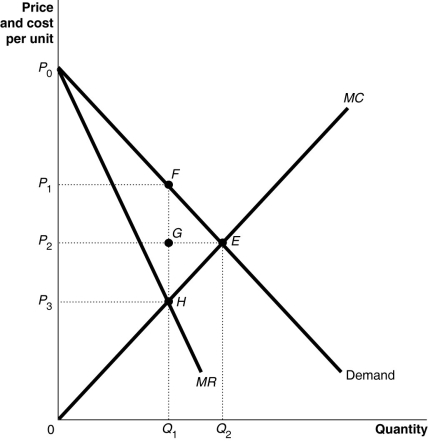
-Refer to Figure 15-10. What is the area that represents consumer surplus under a monopoly?
A) the triangle P0P1F
B) the triangle P0P2E
C) the area P1P2EF
D) the rectangle P1P3HF
Correct Answer:

Verified
Correct Answer:
Verified
Q21: Figure 15-13<br> <img src="https://d2lvgg3v3hfg70.cloudfront.net/TB4193/.jpg" alt="Figure 15-13
Q49: Market power in the United States causes
Q54: Table 15-4<br> <img src="https://d2lvgg3v3hfg70.cloudfront.net/TB4193/.jpg" alt="Table 15-4
Q123: A profit-maximizing monopoly produces a lower output
Q161: A Herfindahl-Hirschman Index is calculated by<br>A)summing the
Q178: Governments grant patents to encourage<br>A)research and development
Q226: Figure 15-4<br> <img src="https://d2lvgg3v3hfg70.cloudfront.net/TB4193/.jpg" alt="Figure 15-4
Q244: Table 15-1<br> <img src="https://d2lvgg3v3hfg70.cloudfront.net/TB4193/.jpg" alt="Table 15-1
Q253: Beginning in 1965, the head of the
Q269: Table 15-4<br> <img src="https://d2lvgg3v3hfg70.cloudfront.net/TB4193/.jpg" alt="Table 15-4