Multiple Choice
Figure 15-12
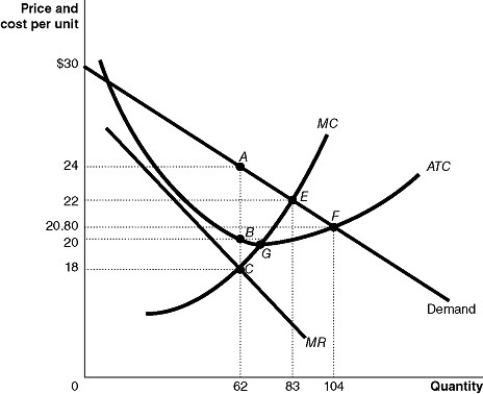
Figure 15-12 shows the cost and demand curves for a monopolist.
-Refer to Figure 15-12.If the firm maximizes its profits, the deadweight loss to society due to this monopoly is equal to the area
A) ABF.
B) ABEG.
C) ACE.
D) EFG.
Correct Answer:

Verified
Correct Answer:
Verified
Q30: Economic efficiency requires that a natural monopoly's
Q31: A merger between U.S.Steel and General Motors
Q32: Figure 15-12<br> <img src="https://d2lvgg3v3hfg70.cloudfront.net/TB4193/.jpg" alt="Figure 15-12
Q33: What is a public franchise? Are all
Q34: Consider an industry that is made up
Q36: Figure 15-17<br> <img src="https://d2lvgg3v3hfg70.cloudfront.net/TB4193/.jpg" alt="Figure 15-17
Q37: Why does a monopoly cause a deadweight
Q38: If a monopolist's marginal revenue is $35
Q39: If a theatre company expects $250,000 in
Q40: A merger between the Ford Motor Company