Multiple Choice
Figure 15-15 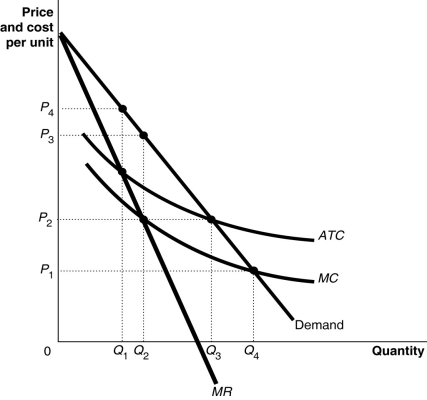 Figure 15-15 shows the cost and demand curves for the Erickson Power Company.
-Refer to Figure 15-15. The firm would maximize profit by producing
A) Q1 units.
B) Q2 units.
C) Q3 units.
D) Q4 units.
Correct Answer:

Verified
Correct Answer:
Verified
Q16: Firms that face downward-sloping demand curves for
Q55: Table 15-1<br> <img src="https://d2lvgg3v3hfg70.cloudfront.net/TB4193/.jpg" alt="Table 15-1
Q61: Producers in perfect competition receive a smaller
Q68: A firm that has the ability to
Q73: Assume a hypothetical case where an industry
Q76: What is the difference between a monopoly's
Q113: There are several types of barriers to
Q117: Microsoft hires marketing and sales specialists to
Q122: Economic efficiency in a free market occurs
Q176: The demand curve for a monopoly's product