Multiple Choice
Figure 5-2 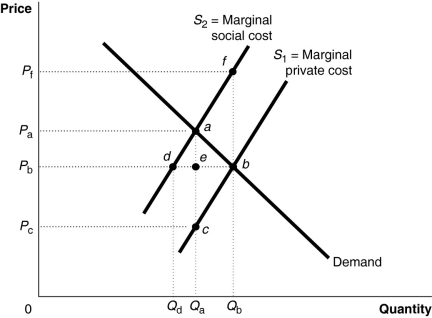 Figure 5-2 shows a market with a negative externality.
-Refer to Figure 5-2. The size of marginal external costs can be determined by
A) S2 + S1 at each output level.
B) S2 - S1 at each output level.
C) the supply curve S2.
D) the supply curve S1.
Correct Answer:

Verified
Correct Answer:
Verified
Q33: Which of the following best illustrates free
Q63: The social cost of cutting trees for
Q110: Figure 5-3<br> <img src="https://d2lvgg3v3hfg70.cloudfront.net/TB4193/.jpg" alt="Figure 5-3
Q112: Article Summary<br>According to the online real estate
Q153: A quasi-public good is similar to a
Q155: Figure 5-2 <img src="https://d2lvgg3v3hfg70.cloudfront.net/TB7397/.jpg" alt="Figure 5-2
Q163: Figure 5-10 <img src="https://d2lvgg3v3hfg70.cloudfront.net/TB7397/.jpg" alt="Figure 5-10
Q164: Figure 5-4 <img src="https://d2lvgg3v3hfg70.cloudfront.net/TB7397/.jpg" alt="Figure 5-4
Q212: An external cost is created when you<br>A)graduate
Q229: Figure 5-7<br> <img src="https://d2lvgg3v3hfg70.cloudfront.net/TB4193/.jpg" alt="Figure 5-7