Multiple Choice
Figure 5-5 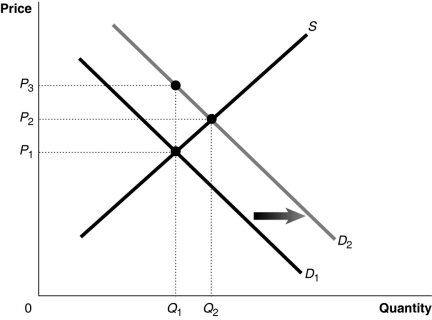 Figure 5-5 shows a market with an externality. The current market equilibrium output of Q1 is not the economically efficient output. The economically efficient output is Q2.
-Refer to Figure 5-5. Suppose the current market equilibrium output of Q1 is not the economically efficient output because of an externality. The economically efficient output is Q2. In that case, diagram shows
A) the effect of a subsidy granted to producers of a good.
B) the effect of an excess demand in a market.
C) the effect of a positive externality in the consumption of a good.
D) the effect of a negative externality in the consumption of a good.
Correct Answer:

Verified
Correct Answer:
Verified
Q55: Figure 5-13<br> <img src="https://d2lvgg3v3hfg70.cloudfront.net/TB4193/.jpg" alt="Figure 5-13
Q134: A negative externality exists if<br>A)there are price
Q185: Offering to pay the passenger in front
Q186: Figure 5-9 <img src="https://d2lvgg3v3hfg70.cloudfront.net/TB7397/.jpg" alt="Figure 5-9
Q186: Economic incentives are designed to make individual
Q187: Figure 5-6 <img src="https://d2lvgg3v3hfg70.cloudfront.net/TB7397/.jpg" alt="Figure 5-6
Q188: Figure 5-5 <img src="https://d2lvgg3v3hfg70.cloudfront.net/TB7397/.jpg" alt="Figure 5-5
Q222: When there is a negative externality, the
Q235: Figure 5-8<br> <img src="https://d2lvgg3v3hfg70.cloudfront.net/TB4193/.jpg" alt="Figure 5-8
Q242: Anyone can purchase sulfur dioxide emission allowances