Multiple Choice
Figure 5-5 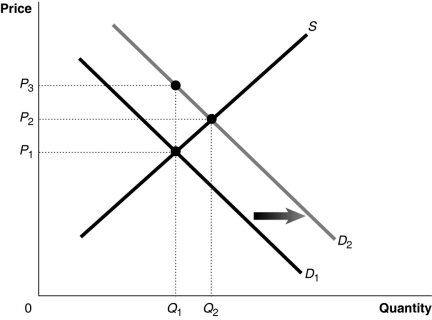 Figure 5-5 shows a market with an externality. The current market equilibrium output of Q1 is not the economically efficient output. The economically efficient output is Q2.
-Refer to Figure 5-5. If, because of an externality, the economically efficient output is Q2 and not the current equilibrium output of Q1, what does D1 represent?
A) the demand curve reflecting external benefits
B) the demand curve reflecting social benefits
C) the demand curve reflecting private benefits
D) the demand curve reflecting the sum of private and social benefits
Correct Answer:

Verified
Correct Answer:
Verified
Q11: The costs in time and other resources
Q13: Assume that emissions from electric utilities contribute
Q18: "A competitive market achieves economic efficiency by
Q36: Overuse of a common resource may be
Q61: A public good is a good that
Q96: Figure 5-4 <img src="https://d2lvgg3v3hfg70.cloudfront.net/TB7397/.jpg" alt="Figure 5-4
Q116: What is an externality?
Q124: If electric utilities continually reduce their emissions
Q173: When there is a negative externality, the
Q184: Assume that production from an electric utility