Multiple Choice
Figure 4-6 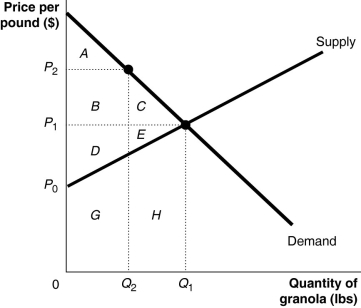 Figure 4-6 shows the market for granola. The market is initially in equilibrium at a price of P1 and a quantity of Q1. Now suppose producers decide to cut output to Q2 in order to raise the price to P2.
-Refer to Figure 4-6. What area represents producer surplus at the equilibrium price of P1?
A) A + B + D
B) D + E
C) D + E + G + H
D) A + B + C + D + E
Correct Answer:

Verified
Correct Answer:
Verified
Q9: Figure 4-1<br> <img src="https://d2lvgg3v3hfg70.cloudfront.net/TB4193/.jpg" alt="Figure 4-1
Q27: Each point on a _ curve shows
Q123: Producer surplus is the difference between the
Q165: The difference between the highest price a
Q201: Figure 4-1<br> <img src="https://d2lvgg3v3hfg70.cloudfront.net/TB4193/.jpg" alt="Figure 4-1
Q204: A tax that imposes a small excess
Q387: Figure 4-10 <img src="https://d2lvgg3v3hfg70.cloudfront.net/TB7397/.jpg" alt="Figure 4-10
Q389: Figure 4-5 <img src="https://d2lvgg3v3hfg70.cloudfront.net/TB7397/.jpg" alt="Figure 4-5
Q390: Table 4-12<br> <img src="https://d2lvgg3v3hfg70.cloudfront.net/TB7397/.jpg" alt="Table 4-12
Q395: Table 4-13<br> <img src="https://d2lvgg3v3hfg70.cloudfront.net/TB7397/.jpg" alt="Table 4-13