Multiple Choice
Table 4-7
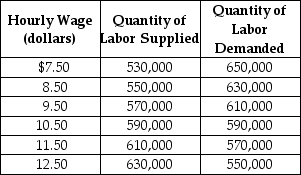 Table 4-7 shows the demand and supply schedules for the labor market in the city of Pixley.
-Refer to Table 4-7. Suppose that the quantity of labor demanded decreases by 80,000 at each wage level. What are the new free market equilibrium hourly wage and the new equilibrium quantity of labor?
A) W = $8.50; Q = 550,000
B) W = $12.50; Q = 630,000
C) W = $9.50; Q = 570,000
D) W = $9.50; Q = 590,000
Correct Answer:

Verified
Correct Answer:
Verified
Q4: In a competitive market, the demand curve
Q5: Table 4-2<br> <img src="https://d2lvgg3v3hfg70.cloudfront.net/TB4193/.jpg" alt="Table 4-2
Q21: Figure 4-3 <img src="https://d2lvgg3v3hfg70.cloudfront.net/TB7397/.jpg" alt="Figure 4-3
Q22: Figure 4-11 <img src="https://d2lvgg3v3hfg70.cloudfront.net/TB7397/.jpg" alt="Figure 4-11
Q23: Figure 4-2 <img src="https://d2lvgg3v3hfg70.cloudfront.net/TB7397/.jpg" alt="Figure 4-2
Q27: Table 4-11<br> <img src="https://d2lvgg3v3hfg70.cloudfront.net/TB7397/.jpg" alt="Table 4-11
Q58: Suppose the demand curve for a product
Q81: Economists refer a to a market where
Q121: A tax is efficient if it imposes
Q209: Monique buys a new television for $795.She