Multiple Choice
Table 4-7
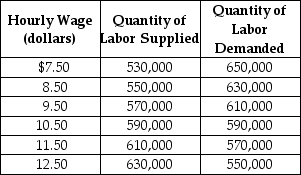 Table 4-7 shows the demand and supply schedules for the labor market in the city of Pixley.
-Refer to Table 4-7. Suppose that the quantity of labor demanded increases by 40,000 at each wage level. What are the new free market equilibrium hourly wage and the new equilibrium quantity of labor?
A) W = $8.50; Q = 550,000
B) W = $12.50; Q = 630,000
C) W = $9.50; Q = 570,000
D) W = $11.50; Q = 610,000
Correct Answer:

Verified
Correct Answer:
Verified
Q56: Economic efficiency is achieved when there is
Q61: What is marginal benefit? Which curve is
Q162: The actual division of the burden of
Q172: Figure 4-7 <img src="https://d2lvgg3v3hfg70.cloudfront.net/TB7397/.jpg" alt="Figure 4-7
Q173: Figure 4-20 <img src="https://d2lvgg3v3hfg70.cloudfront.net/TB7397/.jpg" alt="Figure 4-20
Q174: Figure 4-9 <img src="https://d2lvgg3v3hfg70.cloudfront.net/TB7397/.jpg" alt="Figure 4-9
Q176: Figure 4-6 <img src="https://d2lvgg3v3hfg70.cloudfront.net/TB7397/.jpg" alt="Figure 4-6
Q177: Figure 4-18 <img src="https://d2lvgg3v3hfg70.cloudfront.net/TB7397/.jpg" alt="Figure 4-18
Q192: Equilibrium in a competitive market results in
Q195: Table 4-3<br> <img src="https://d2lvgg3v3hfg70.cloudfront.net/TB4193/.jpg" alt="Table 4-3