Multiple Choice
Figure 4-9 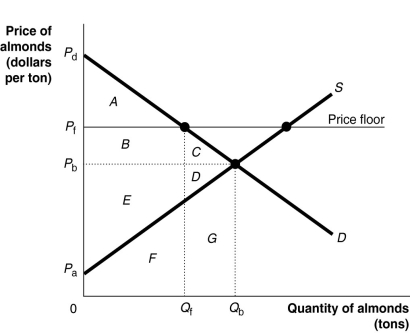 Figure 4-9 shows the demand and supply curves for the almond market. The government believes that the equilibrium price is too low and tries to help almond growers by setting a price floor at Pf.
-Refer to Figure 4-9. What area represents the deadweight loss after the imposition of the price floor?
A) C + D + G
B) F + G
C) C + D
D) C + D + F + G
Correct Answer:

Verified
Correct Answer:
Verified
Q27: When the marginal benefit equals the marginal
Q31: "Taxes are what we pay for a
Q59: If the price of garlic is represented
Q62: The difference between the _ for a
Q108: Which of the following is a consequence
Q118: Table 4-3<br> <img src="https://d2lvgg3v3hfg70.cloudfront.net/TB4193/.jpg" alt="Table 4-3
Q145: Figure 4-15 <img src="https://d2lvgg3v3hfg70.cloudfront.net/TB7397/.jpg" alt="Figure 4-15
Q150: Figure 4-3 <img src="https://d2lvgg3v3hfg70.cloudfront.net/TB7397/.jpg" alt="Figure 4-3
Q151: Figure 4-7 <img src="https://d2lvgg3v3hfg70.cloudfront.net/TB7397/.jpg" alt="Figure 4-7
Q194: In a competitive market equilibrium the _