Multiple Choice
Table 4-8
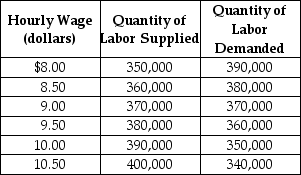 Table 4-8 shows the demand and supply schedules for the low-skilled labor market in the city of Westover.
-Refer to Table 4-8. Suppose that the quantity of labor demanded decreases by 40,000 at each wage level. What are the new free market equilibrium hourly wage and the new equilibrium quantity of labor?
A) W = $10.00; Q = 390,000
B) W = $9.50; Q = 380,000
C) W = $8.50; Q = 340,000
D) W = $8.00; Q = 350,000
Correct Answer:

Verified
Correct Answer:
Verified
Q81: If Uber is required to start paying
Q102: Lucinda buys a new GPS system for
Q104: The additional cost to a firm of
Q105: If the market price is at equilibrium,
Q119: The division of the burden of a
Q321: Figure 4-8 <img src="https://d2lvgg3v3hfg70.cloudfront.net/TB7397/.jpg" alt="Figure 4-8
Q322: Figure 4-3 <img src="https://d2lvgg3v3hfg70.cloudfront.net/TB7397/.jpg" alt="Figure 4-3
Q323: Table 4-7<br> <img src="https://d2lvgg3v3hfg70.cloudfront.net/TB7397/.jpg" alt="Table 4-7
Q324: Figure 4-12 <img src="https://d2lvgg3v3hfg70.cloudfront.net/TB7397/.jpg" alt="Figure 4-12
Q328: Figure 4-5 <img src="https://d2lvgg3v3hfg70.cloudfront.net/TB7397/.jpg" alt="Figure 4-5