Essay
Figure 4-19 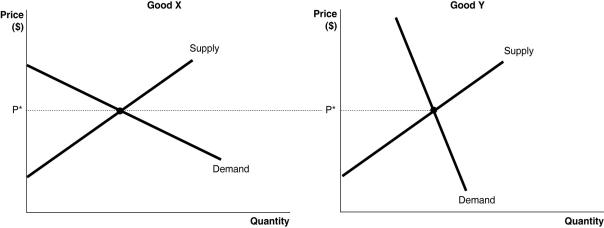
-Refer to Figure 4-19. The figure above illustrates the markets for two goods, Good X and Good Y. Suppose an identical dollar tax is imposed on sellers in each market.
a. Compare the consumer burden and producer burden in each market. Illustrate your answer graphically.
b. If the goal of the government is to raise revenue with minimum impact to quantity consumed, in which market should the tax be imposed?
c. If the goal of the government is to discourage consumption, in which market should the tax be imposed?
Correct Answer:

Verified
a. See the figure be...View Answer
Unlock this answer now
Get Access to more Verified Answers free of charge
Correct Answer:
Verified
View Answer
Unlock this answer now
Get Access to more Verified Answers free of charge
Q36: What is the difference between scarcity and
Q72: Suppose an excise tax of $1 is
Q83: Table 4-13<br> <img src="https://d2lvgg3v3hfg70.cloudfront.net/TB7397/.jpg" alt="Table 4-13
Q84: Table 4-6<br> <img src="https://d2lvgg3v3hfg70.cloudfront.net/TB7397/.jpg" alt="Table 4-6
Q87: The additional benefit to a consumer from
Q88: Figure 4-14 <img src="https://d2lvgg3v3hfg70.cloudfront.net/TB7397/.jpg" alt="Figure 4-14
Q91: Figure 4-5 <img src="https://d2lvgg3v3hfg70.cloudfront.net/TB7397/.jpg" alt="Figure 4-5
Q97: Government intervention in agricultural markets in the
Q119: The total amount of producer surplus in
Q212: Government intervention in agriculture began in the