Multiple Choice
Figure 3-8 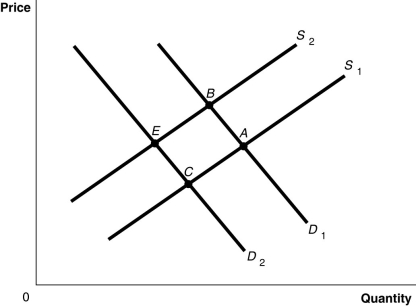
-Refer to Figure 3-8. The graph in this figure illustrates an initial competitive equilibrium in the market for apples at the intersection of D2 and S2 (point E) . Which of the following changes would cause the equilibrium to change to point A?
A) a positive change in the technology used to produce apples and decrease in the price of oranges, a substitute for apples
B) an increase in the wages of apple workers and a decrease in the price of oranges, a substitute for apples
C) an increase in the number of apple producers and a decrease in the number of apple trees as a result of disease
D) a decrease in the wages of apple workers and an increase in the price of oranges, a substitute for apples
Correct Answer:

Verified
Correct Answer:
Verified
Q21: Figure 3-2 <img src="https://d2lvgg3v3hfg70.cloudfront.net/TB1236/.jpg" alt="Figure 3-2
Q24: Auctions in recent years have resulted in
Q29: Assume that airline tickets are a normal
Q43: Figure 3-1 <img src="https://d2lvgg3v3hfg70.cloudfront.net/TB7397/.jpg" alt="Figure 3-1
Q84: Nearly one-fifth of China's 1.38 billion people
Q87: A change in which variable will change
Q102: An increase in the price of pineapples
Q141: Figure 3-6<br> <img src="https://d2lvgg3v3hfg70.cloudfront.net/TB4193/.jpg" alt="Figure 3-6
Q142: If the sales of carbonated sodas continue
Q143: A decrease in the price of inputs