Multiple Choice
Figure 3-8 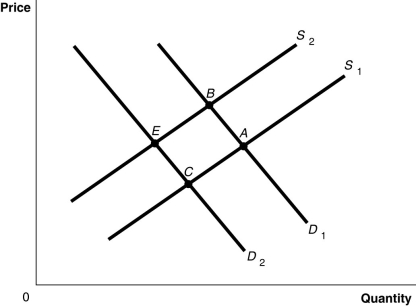
-Refer to Figure 3-8. The graph in this figure illustrates an initial competitive equilibrium in the market for apples at the intersection of D1 and S1 (point A) . If there is an increase in the wages of apple workers and an increase in the price of oranges, a substitute for apples, the equilibrium could move to which point?
A) none of the points shown
B) B
C) C
D) E
Correct Answer:

Verified
Correct Answer:
Verified
Q19: An increase in quantity supplied is represented
Q22: Figure 3-6<br> <img src="https://d2lvgg3v3hfg70.cloudfront.net/TB4193/.jpg" alt="Figure 3-6
Q24: How does the increasing use of digital
Q64: The _ effect of a price change
Q81: Figure 3-2 <img src="https://d2lvgg3v3hfg70.cloudfront.net/TB1236/.jpg" alt="Figure 3-2
Q109: "Because apples and oranges are substitutes, an
Q147: Scarcity is defined as the situation that
Q207: Suppose that when the price of strawberries
Q334: Figure 3-1 <img src="https://d2lvgg3v3hfg70.cloudfront.net/TB7397/.jpg" alt="Figure 3-1
Q336: Figure 3-1 <img src="https://d2lvgg3v3hfg70.cloudfront.net/TB7397/.jpg" alt="Figure 3-1