Multiple Choice
Figure 2-4 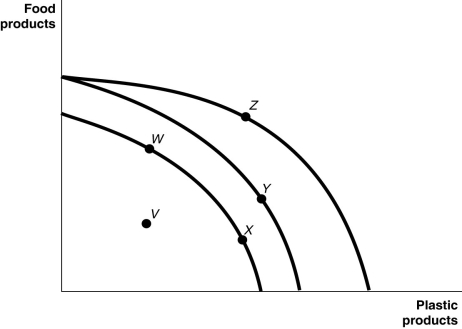 Figure 2-4 shows various points on three different production possibilities frontiers for a nation.
-Refer to Figure 2-4. Consider the following movements:
a. from point V to point W
b. from point W to point Y
c. from point Y to point Z
Which of the movements listed above represents economic growth?
A) a, b, and c
B) b and c only
C) a only
D) b only
Correct Answer:

Verified
Correct Answer:
Verified
Q51: In the circular flow model, producers<br>A)sell goods
Q64: Table 2-1<br>Production choices for Tomaso's Trattoria<br> <img
Q77: In a two-good,two country world,if one country
Q93: Figure 2-10 <img src="https://d2lvgg3v3hfg70.cloudfront.net/TB7397/.jpg" alt="Figure 2-10
Q94: Table 2-18<br> <img src="https://d2lvgg3v3hfg70.cloudfront.net/TB7397/.jpg" alt="Table 2-18
Q95: Table 2-8<br> <img src="https://d2lvgg3v3hfg70.cloudfront.net/TB7397/.jpg" alt="Table 2-8
Q96: Figure 2-12 <img src="https://d2lvgg3v3hfg70.cloudfront.net/TB7397/.jpg" alt="Figure 2-12
Q97: Table 2-16<br> <img src="https://d2lvgg3v3hfg70.cloudfront.net/TB7397/.jpg" alt="Table 2-16
Q110: A production possibilities frontier with a _
Q179: Figure 2-8<br> <img src="https://d2lvgg3v3hfg70.cloudfront.net/TB4193/.jpg" alt="Figure 2-8