Multiple Choice
Figure 2-14 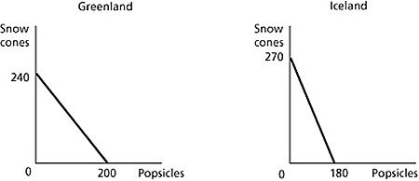 Figure 2-14 shows the production possibilities frontiers for Greenland and Iceland. Each country produces two goods, snow cones and popsicles.
-Refer to Figure 2-14. What is the opportunity cost of producing 1 popsicle in Iceland?
A) 1 1/2 snow cones
B) 3/4 of a snow cone
C) 2/3 of a snow cone
D) 270 snow cones
Correct Answer:

Verified
Correct Answer:
Verified
Q25: Table 2-14<br> <img src="https://d2lvgg3v3hfg70.cloudfront.net/TB7397/.jpg" alt="Table 2-14
Q27: Table 2-7<br> <img src="https://d2lvgg3v3hfg70.cloudfront.net/TB7397/.jpg" alt="Table 2-7
Q32: Table 2-17<br> <img src="https://d2lvgg3v3hfg70.cloudfront.net/TB7397/.jpg" alt="Table 2-17
Q34: Table 2-16<br> <img src="https://d2lvgg3v3hfg70.cloudfront.net/TB7397/.jpg" alt="Table 2-16
Q35: Table 2-20<br> <img src="https://d2lvgg3v3hfg70.cloudfront.net/TB7397/.jpg" alt="Table 2-20
Q47: Consider a country that produces only two
Q49: Should countries specialize in producing goods and
Q57: Figure 2-4 <img src="https://d2lvgg3v3hfg70.cloudfront.net/TB1236/.jpg" alt="Figure 2-4
Q148: Which of the following is an example
Q190: Suppose your expenses for this term are