Multiple Choice
Figure 2-15 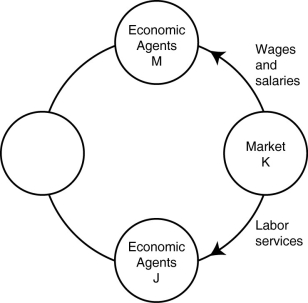
-Refer to Figure 2-15. One segment of the circular flow diagram in the figure shows the flow of wages and salaries from market K to economic agents M. What is market K and who are economic agents M?
A) K = factor markets; M = households
B) K = product markets; M = households
C) K = factor markets; M = firms
D) K = product markets; M = firms
Correct Answer:

Verified
Correct Answer:
Verified
Q7: If opportunity costs are constant, the production
Q111: Which of the following statements about a
Q125: Figure 2-4 <img src="https://d2lvgg3v3hfg70.cloudfront.net/TB1236/.jpg" alt="Figure 2-4
Q131: Figure 2-10 <img src="https://d2lvgg3v3hfg70.cloudfront.net/TB7397/.jpg" alt="Figure 2-10
Q164: Table 2-2<br>Production choices for Billie's Bedroom Shop<br>
Q185: The points outside the production possibilities frontier
Q192: _ shows that if all resources are
Q198: An example of a factor of production
Q211: Any output combination along a production possibility
Q243: Figure 2-4<br> <img src="https://d2lvgg3v3hfg70.cloudfront.net/TB4193/.jpg" alt="Figure 2-4