Multiple Choice
Figure 2-15 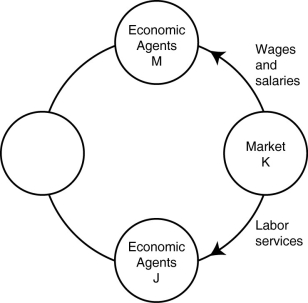
-Refer to Figure 2-15. In the circular flow diagram, economic agents M represent
A) households.
B) product markets.
C) firms.
D) factor markets.
Correct Answer:

Verified
Correct Answer:
Verified
Q23: The slope of a production possibilities frontier<br>A)has
Q102: The production possibilities frontier shows<br>A)the various products
Q182: To increase gas mileage,automobile manufacturers make cars
Q222: Without an increase in the supply of
Q375: Table 2-14<br> <img src="https://d2lvgg3v3hfg70.cloudfront.net/TB7397/.jpg" alt="Table 2-14
Q376: Figure 2-11 <img src="https://d2lvgg3v3hfg70.cloudfront.net/TB7397/.jpg" alt="Figure 2-11
Q381: Figure 2-8 <img src="https://d2lvgg3v3hfg70.cloudfront.net/TB7397/.jpg" alt="Figure 2-8
Q382: Table 2-16<br> <img src="https://d2lvgg3v3hfg70.cloudfront.net/TB7397/.jpg" alt="Table 2-16
Q383: Table 2-15<br> <img src="https://d2lvgg3v3hfg70.cloudfront.net/TB7397/.jpg" alt="Table 2-15
Q385: Figure 2-18 <img src="https://d2lvgg3v3hfg70.cloudfront.net/TB7397/.jpg" alt="Figure 2-18