Multiple Choice
The graph below indicates the temperature of Earth's atmosphere as a function of altitude.At what altitude is Earth's atmosphere the coldest? 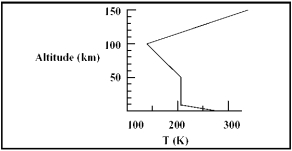
A) 100 km
B) 130 km
C) 0 km
D) 150 km
E) 350 km
Correct Answer:

Verified
Correct Answer:
Verified
Related Questions
Q15: Pressure (P) waves can travel through a
Q21: Earth's magnetic field has reversed itself.
Q46: Why would a decrease in the density
Q48: What property does carbon dioxide have that
Q49: Which of the following terrestrial planets does
Q50: The Earth has ._.the Earth's Moon which
Q51: The Van Allen belts are<br>A) composed of
Q52: What is the most abundant gas in
Q55: The terrestrial planets are all made of<br>A)
Q56: Saying that Earth's mantle is plastic means